The future electricity grid requires smart features like flexibility, accessibility, reliability, and high quality of supply power. These features are effectively offered by the smart grid. The transition to sustainable power systems with high penetration of distributed, renewable energy sources like pho-tovoltaic (PV) installations as well as the large-scale integration of new device technologies, like battery electric vehicles (BEV), may result in a reduction of power quality (PQ). The degradation of PQ can adversely affect other devices resulting in lifetime reduction, malfunction or even damage. Therefore, power quality becomes an important topic with respect to smart grids.
Due to this, network operators have intensified their PQ measurement activities and as result, the amount of PQ measurements grows fast. PQ is distinguished in voltage and current quality and is quantified by a set of parameters, which either belongs to events (discontinuous parameters, e.g. dips) or variations (continuous parameters, e.g. harmonic distortion). In many cases the data analy-sis is usually limited to compliance assessment (e.g. in Europe according to EN 50160) and no deeper analysis of the data is carried out due to the lack of adequate tools and/or the feasibility of manual processing. Therefore, most of the highly valuable information in the measurement data remains unused. In order to conduct efficient and automatic data analysis, and extract useful in-formation from PQ data, data mining techniques have found wide application. One particular ap-plication example is the detection of abnormal behavior in continuous PQ parameters, i.e. in cur-rent and voltage harmonics [1].
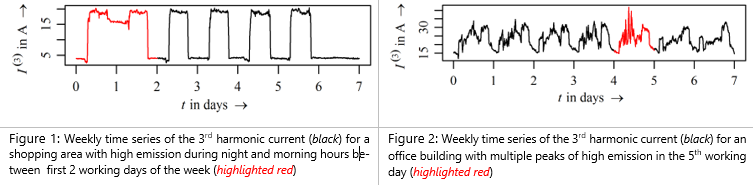
PQ in public LV networks is mainly determined by the type and number of connected devices. De-pending on their usage, PQ parameters exhibit variations, which are usually characterized by daily and weekly intervals. Specific events, like equipment failure, network reconfiguration or connection of new disturbing device can cause sudden changes in the “typical” variation characteristic. This is referred to as “atypical” behavior or anomaly and should be automatically detected as well as re-ported to the network operator in future smart grids. Examples of such anomalies can be seen in the Figures 1 and 2. Days in black color present “typical” patterns for two different types of con-sumers, i.e. a shopping area and an office area, respectively. However, days in red are very different from days in black and present abnormal variation, i.e. anomalies.
In order to detect anomalies presented in the Figures 1 and 2, anomaly detection method has been developed. The method includes three steps: feature-based time series representation, detec-tion and classification. Feature-based representation is a process of constructing new variables, i.e. feature variables from original variables, in order to preserve underlying data behav-ior/characteristic. Depending on the choice of feature-based representation, reduction in the data dimensionality, increase in the method performance, results interpretability and deep insights about the problem can be gained. Moreover, this information can in turn increase domain knowledge about specific problem and motivate future research. Therefore, in order to characterize and distinguish normal from abnormal variation in time series of PQ data, three features can be used. These features present simple estimates of the distribution of time-series values and are maximum value, mean value and slope-based index. The maximum value estimates the typical range of daily variation. If a day has an abnormal high value, e.g. due to the failure of an equip-ment, then this day can be classified as outside of typical daily variation. The second feature is the mean value, which is used to quantify central data tendency. A day with an abnormal mean value has a different shape with usually multiple values being different to the normal behavior, e.g. a new device is connected for a longer time on a day. The third feature is the slope-based index, which can capture oscillation and steepness of changes between consecutive data points. A day with ab-normal slope-based feature characterizes a significant change in the volatility of the data, which can be caused e.g. by a change in the user behavior.
After original time series is represented as feature time series, anomalies can be detected using a threshold. The choice of anomaly detection threshold depends on several factors such as data type, data dimensionality and assumptions made about data distribution. One of the simplest and effective ways to detect anomalies in univariate time series data is the application of a statistical threshold. One of such thresholds is based on the interquartile range (IQR) and the 25th and 75th percentiles. The threshold can be applied over the complete time series or over a sliding window.
As the final step, developed features can be used in order to derive further information and in-sights into the root causes of anomaly. The developed method has been tested on different time series of PQ parameters that were measured in public LV networks. On average, the method has a high efficiency: 86% of the prior manually identified anomalies have been detected using the mean feature, 100% using the maximum feature and 89% using the slope-based feature.
Data mining techniques are a powerful tool able to solve different types of problems such as power quality disturbance detection, topology identification, electric device state estimation, renewable load forecasting and many other. Therefore, the application of data analytics plays an important role for engineers to perceive and control the traditional electrical system and make it smart.
[1] O. Zyabkina, M. Domagk, J. Meyer, and P. Schegner, “A Feature-Based Method for Automatic Anomaly Identification in Power Quality Measurements,” 2018 IEEE Int. Conf. Probabilistic Methods Appl. to Power Syst., pp. 1–6, 2018, doi: 10.1109/PMAPS.2018.8440460.